- « Previous Page
- 1
- …
- 25
- 26
- 27
- 28
- 29
- …
- 40
- Next Page »
Weekly Market Report

For Week Ending August 15, 2015
According to statistics jointly released by the U.S. Census Bureau and the Department of Housing and Urban Development, privately-owned housing starts rose 0.2 percent when comparing July 2015 to the prior month and 10.1 percent when compared to July 2014. These numbers are at the highest levels the market has seen since October 2007. This bodes well for the eventual landing of a flock of potential buyers currently holding in a rental pattern or the wakening of those resting in extended parental basement hibernation.
In the Twin Cities region, for the week ending August 15:
- New Listings increased 3.1% to 1,746
- Pending Sales increased 18.9% to 1,268
- Inventory decreased 12.3% to 16,950
For the month of July:
- Median Sales Price increased 4.7% to $225,000
- Days on Market decreased 7.4% to 63
- Percent of Original List Price Received increased 0.8% to 97.6%
- Months Supply of Inventory decreased 19.6% to 3.7
All comparisons are to 2014
Click here for the full Weekly Market Activity Report. From The Skinny Blog.
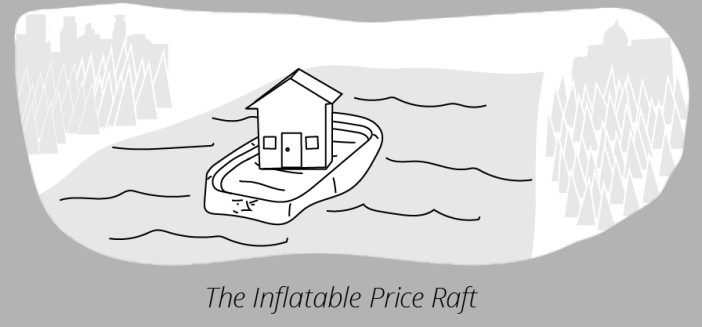
The Inflatable Price Raft
“Accept certain inalienable truths: Prices will rise. Politicians will philander. You, too, will get old. And when you do, you’ll fantasize that when you were young, prices were reasonable, politicians were noble and children respected their elders.” – Mary Schmich
We hear a lot about home prices and how they change over time. But by far the biggest pitfall of dealing in absolute dollar terms is that a dollar in 2015 does not buy what a dollar used to get you in 1960 or even in 2010. If you’ve ever purchased the same product or service even just several years apart, you implicitly know this, though you may not be familiar with some of the rationale and technical aspects of tracking and adjusting for inflation. And let’s be clear here: that is ok!
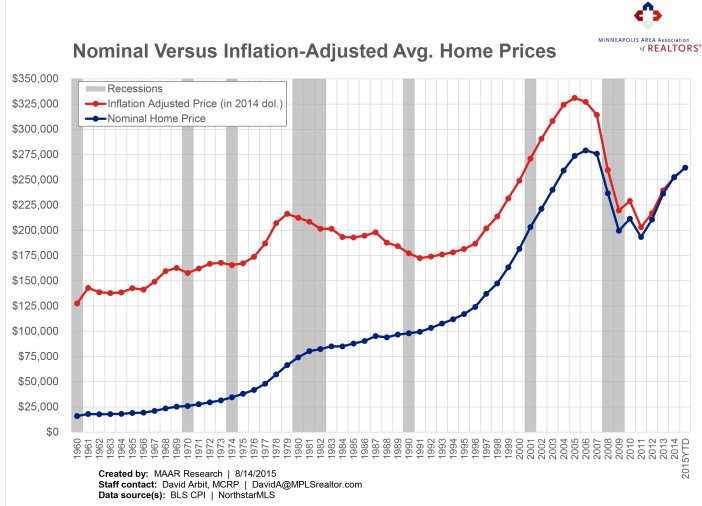
While the nominal (not inflation-adjusted) home price has certainly increased in absolute terms, the typical home that cost $15,977 in 1960 dollars would actually cost exactly $127,635 in 2014 dollars. So a lot of what appears to be price gains is actually attributable to inflation, though not all of it. This is why it’s important to separate out inflation-adjusted prices from nominal, reported prices. It’s the best way to answer the question: excluding the effect of inflation, how much did real home prices actually increase?
The Consumer Price Index (CPI) is the most common method to account for inflation when dealing with time-series data stated in currency units. Using the Bureau of Labor Statistics (BLS) CPI, we’ve adjusted historic home prices and restated them in constant 2014 dollars. Note how far apart the trendlines start versus where they end up. Only when nominal prices approach 2014 do the trendlines converge—since, at that point, both nominal and adjusted prices are stated in 2014 dollars.
Enough with the buildup. So what’s really going on here?
Between 1960 and 2015, nominal home prices increased from $15,977 to $261,963, a gain of 1,539.6 percent. During the same period, inflation-adjusted prices increased from $127,635 to the same $261,963 for a more modest gain of 105.2 percent. That’s a big difference, and shows just how much of the run-up in prices can be attributed to inflation.
But it’s also important to note that home prices more than doubled during the 54 year study period (1960-2014) even after adjusting for inflation and despite the downturn. That means after factoring for inflation, home prices kept pace with inflation AND doubled in 54 years. An increase of 105.2 percent spread out across 54 years translates into a 1.95 percent real annualized average growth rate. That finding supports the roughly 2.0 percent annual home price increase that is referenced quite often. It also supports the fact that real estate is an effective inflation hedge.
Equally or perhaps even more importantly, while nominal home prices are quickly nearing their 2006 highs, inflation-adjusted or real home prices are still well below their previous peak in 2005. In other words, while nominal prices seem to be approaching their previous peak, real home prices are still a bargain, especially compared to 2004-6 prices stated in 2014 dollars. That means real home prices have to increase 26.4 percent before they break even with 2005 levels. Nominal home prices have about 6.6 percent to go before reaching 2006 levels.
But life is all about choices, and choices—at least in the strict economic sense—represent a series of opportunity costs. An opportunity cost of a choice, such as buying a house, is what you give up to get it. Most of us have to choose between two major investments at any given time. Sure, gold and other precious metals might also keep pace with inflation and then some, but you can’t live in a pile of bullion. You can only visit your gold periodically. Investing in a home is one of the most effective inflation hedges out there. Plus, while you’re quietly slaying the inflation dragon and enjoying some appreciation, you’ve got a place to live!
 From The Skinny Blog.
Weekly Market Report

For Week Ending August 8, 2015
That time of year is here for some and on its way for others: School. The summer’s fun is winding down. Perceived as good for some weary parents, bad for some summer-loving kids and standard fare for real estate professionals that know August as a quiet identifier of the expectation of housing market slowdown. That said, home sales and housing prices have both continued to edge up across the country on a macro level compared to last year’s numbers. Let’s take a look at the local trends.
In the Twin Cities region, for the week ending August 8:
- New Listings decreased 2.8% to 1,746
- Pending Sales increased 13.5% to 1,293
- Inventory decreased 11.0% to 17,038
For the month of July:
- Median Sales Price increased 4.7% to $225,000
- Days on Market decreased 7.4% to 63
- Percent of Original List Price Received increased 0.8% to 97.6%
- Months Supply of Inventory decreased 19.6% to 3.7
All comparisons are to 2014
Click here for the full Weekly Market Activity Report. From The Skinny Blog.
Housing Continues to Delight as Summer Activity Starts to “Cool”
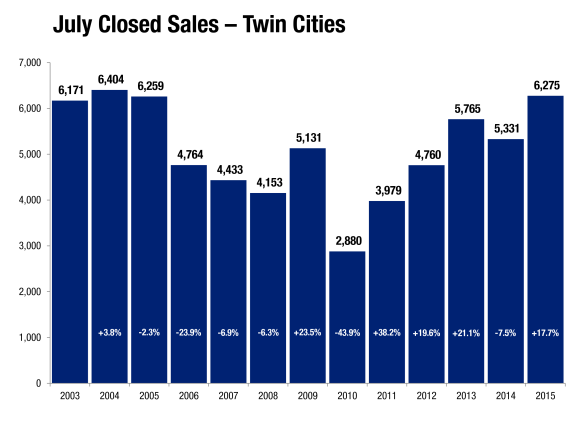
Minneapolis, Minnesota (August 13, 2015) – After purchase demand reached a 10-year record high in June, the Twin Cities metropolitan housing market continued to delight in July. With the spring and summer peak buying season coming to a close, activity levels should begin to cool month-to-month, though most indicators should continue to show year-over-year improvement. The number of signed purchase agreements rose 12.1 percent to 5,716 for July, but are up 18.7 percent so far in 2015. Closed sales increased 17.7 percent to 6,275, but have risen 16.7 percent so far this year. Seller activity was flat compared to last July, new listings fell just 0.4 percent from 7,997 to 7,963. Given that combination of supply and demand movement, the number of available properties for sale fell 11.0 percent to 16,940 homes.
“While those selling their home are yielding top dollar, others wonder if today’s younger generation will be renters forever,” said Mike Hoffman, Minneapolis Area Association of REALTORS® (MAAR) President. “But a National Association of REALTORS® (NAR) survey found that millennials comprised 32.0 percent of all home buyers and 68.0 percent of first-time buyers—both the largest share of any group.”
As interest rates continue to normalize this year, even more pent-up demand from all age brackets will likely be released during this period of historic affordability.
Since demand increased while supply indicators fell—and because a larger share of sales came from the higher-priced traditional segment—the July 2015 median sales price rallied another 4.7 percent to $225,000. The median price per square foot increased 3.4 percent to $120. While the July 2015 median sales price was slightly lower than the June 2015 price, the July 2015 price per square foot was slightly higher than June 2015.
Again due to the factors mentioned above combined with a sense of urgency among buyers, the number of days a property spent on the market fell 7.4 percent to 63 days. Sellers are accepting offers at a median of 98.5 percent of their original list price but 99.7 percent of their final list price, suggesting near-full price offers come quickly once a seller is priced right.
The Twin Cities metropolitan area has 3.7 months’ supply of inventory, which means the region as a whole is a seller’s market. That figure dropped 19.6 percent since July 2014. However, not all local areas, market segments and price points reflect that metropolitan-level reality. This metric is a ratio of supply and demand and indicates how long it would take to completely clear the market assuming no new homes enter the marketplace.
Barring suddenly negative economic data, the Federal Reserve is poised to normalize rates by lifting the Federal Funds rate off of zero starting in September. Mortgage rates are still just below 4.0 percent, compared with a long-term average of over 7.0 percent. Nationally, the economy added 215,000 new private payrolls in July while the unemployment rate held steady at 5.3 percent. The most recent data from the Bureau of Labor Statistics shows the Minneapolis-St. Paul-Bloomington metropolitan area has the third lowest unemployment rate of any major metro.
“We have so many different things going for our region,” said Judy Shields, MAAR President-Elect. “Twin Citizens are smart, and they realize that when rents are high and rising, interest rates are under 4.0 percent and prices are still below their peak, it’s time to consider investing in the stability and predictability of homeownership—in most cases, it’s cheaper than renting.”
Weekly Market Report

For Week Ending August 1, 2015
According to a recent study, housing starts are expected to be slightly over a million for the U.S. in 2015, with more than half of those being single-family homes. New home sales are expected to increase by at least 20 percent compared to last year. An increase in housing starts hints at a state of homeostasis for the residential real estate market. More homes means more choices for buyers, from first-timers to upgraders.
In the Twin Cities region, for the week ending August 1:
- New Listings decreased 8.1% to 1,665
- Pending Sales increased 14.3% to 1,341
- Inventory decreased 10.1% to 17,183
For the month of July:
- Median Sales Price increased 4.7% to $225,000
- Days on Market decreased 7.4% to 63
- Percent of Original List Price Received increased 0.8% to 97.6%
- Months Supply of Inventory decreased 19.6% to 3.7
All comparisons are to 2014
Click here for the full Weekly Market Activity Report. From The Skinny Blog.
Where are the lowest prices?
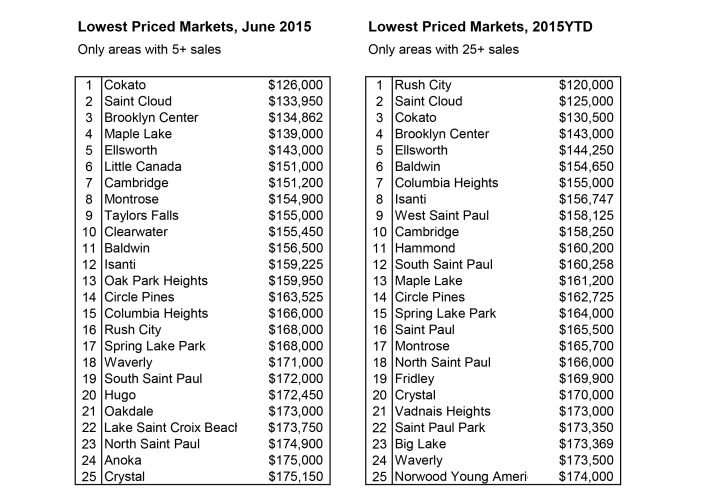
Though not quite as often as the most expensive areas, we are also occasionally asked which cities are the most affordable (least expensive). Below are tables showing the 25 lowest priced markets in the region. The top two tables rank all areas, regardless of market size. The bottom two tables only show areas with a certain volume of sales. The left table uses only June 2015 sales, while the table to the right uses 2015 YTD data (through June). The measure used is still median sales price.
Even more data to the people!
Weekly Market Report

For Week Ending July 25, 2015
According to the U.S. Census, homeownership is at 63.4 percent for the second quarter of 2015, down 1.3 percent from the second quarter of 2014. This is the lowest rate of homeownership since 1967. To put that in greater context, homeownership peaked at 69.2 percent in 2004, and the 50-year average is 65.3 percent. Although the data may be indicating otherwise on a macro level, mortgage applications have kept REALTORS® busy through summer.
In the Twin Cities region, for the week ending July 25:
- New Listings increased 1.2% to 1,804
- Pending Sales increased 21.3% to 1,362
- Inventory decreased 9.8% to 17,125
For the month of June:
- Median Sales Price increased 4.7% to $229,900
- Days on Market decreased 5.7% to 66
- Percent of Original List Price Received increased 0.5% to 97.7%
- Months Supply of Inventory decreased 15.9% to 3.7
All comparisons are to 2014
Click here for the full Weekly Market Activity Report. From The Skinny Blog.
Where are the Highest Prices?
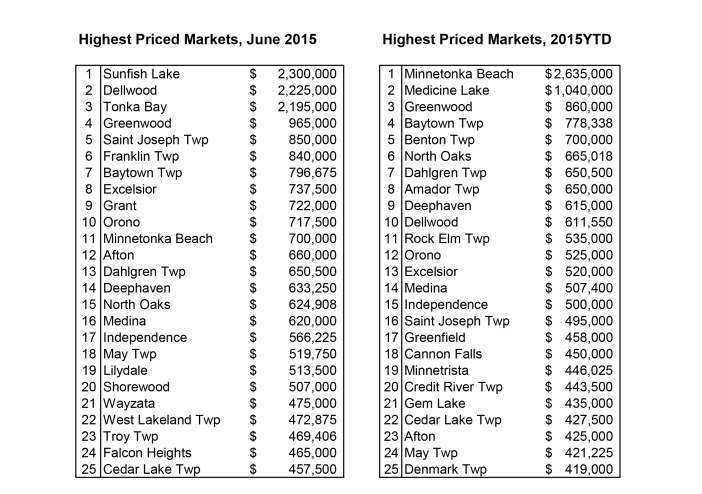
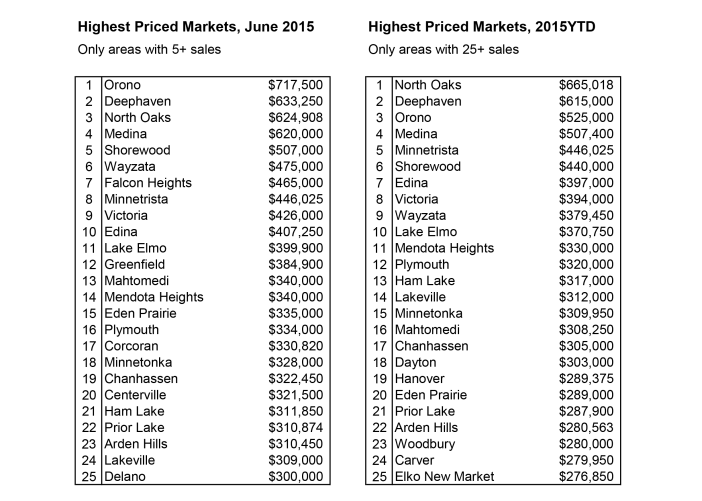
We are often asked “Which cities have the highest home prices?” Whether it’s a member, the media or the general public inquiring, it’s a fairly common question. Wonder no more! Below are tables showing the top 25 highest priced markets in the region. The top two tables rank all areas, regardless of market size. The bottom two tables only show areas with a certain volume of sales. The left table uses just June 2015 sales, while the table to the right uses 2015 YTD data. Of course, the measure used is median sales price.
Data to the people!
Weekly Market Report

For Week Ending July 18, 2015
Let’s try to never forget how bad the U.S. housing market got. The Great Recession lasted from about December 2007 to June 2009. Ever since then, and particularly in the last couple of years, the market has strengthened to once again become a cornerstone in one of the strongest economies in the world. Better lending standards, low oil prices and higher wages are a few of the catalysts for positive change. As we tip into the second half of 2015, the trends still reveal stable housing in a stable economy.
In the Twin Cities region, for the week ending July 18:
- New Listings decreased 7.8% to 1,758
- Pending Sales increased 7.7% to 1,210
- Inventory decreased 9.1% to 16,973
For the month of June:
- Median Sales Price increased 4.7% to $229,900
- Days on Market decreased 5.7% to 66
- Percent of Original List Price Received increased 0.5% to 97.7%
- Months Supply of Inventory decreased 15.9% to 3.7
All comparisons are to 2014
Click here for the full Weekly Market Activity Report. From The Skinny Blog.
- « Previous Page
- 1
- …
- 25
- 26
- 27
- 28
- 29
- …
- 40
- Next Page »
