Lee Homes

RKotoski@CBBurnet.com

  • Home
  • Our Company
  • Gallery and Testimonials
  • Virtual Tours
  • Plans
  • Contact Us

Sellers: flat. Buyers: down. Prices: up.

July 19, 2018 by Adam Tita

By David Arbit on Wednesday, July 18th, 2018

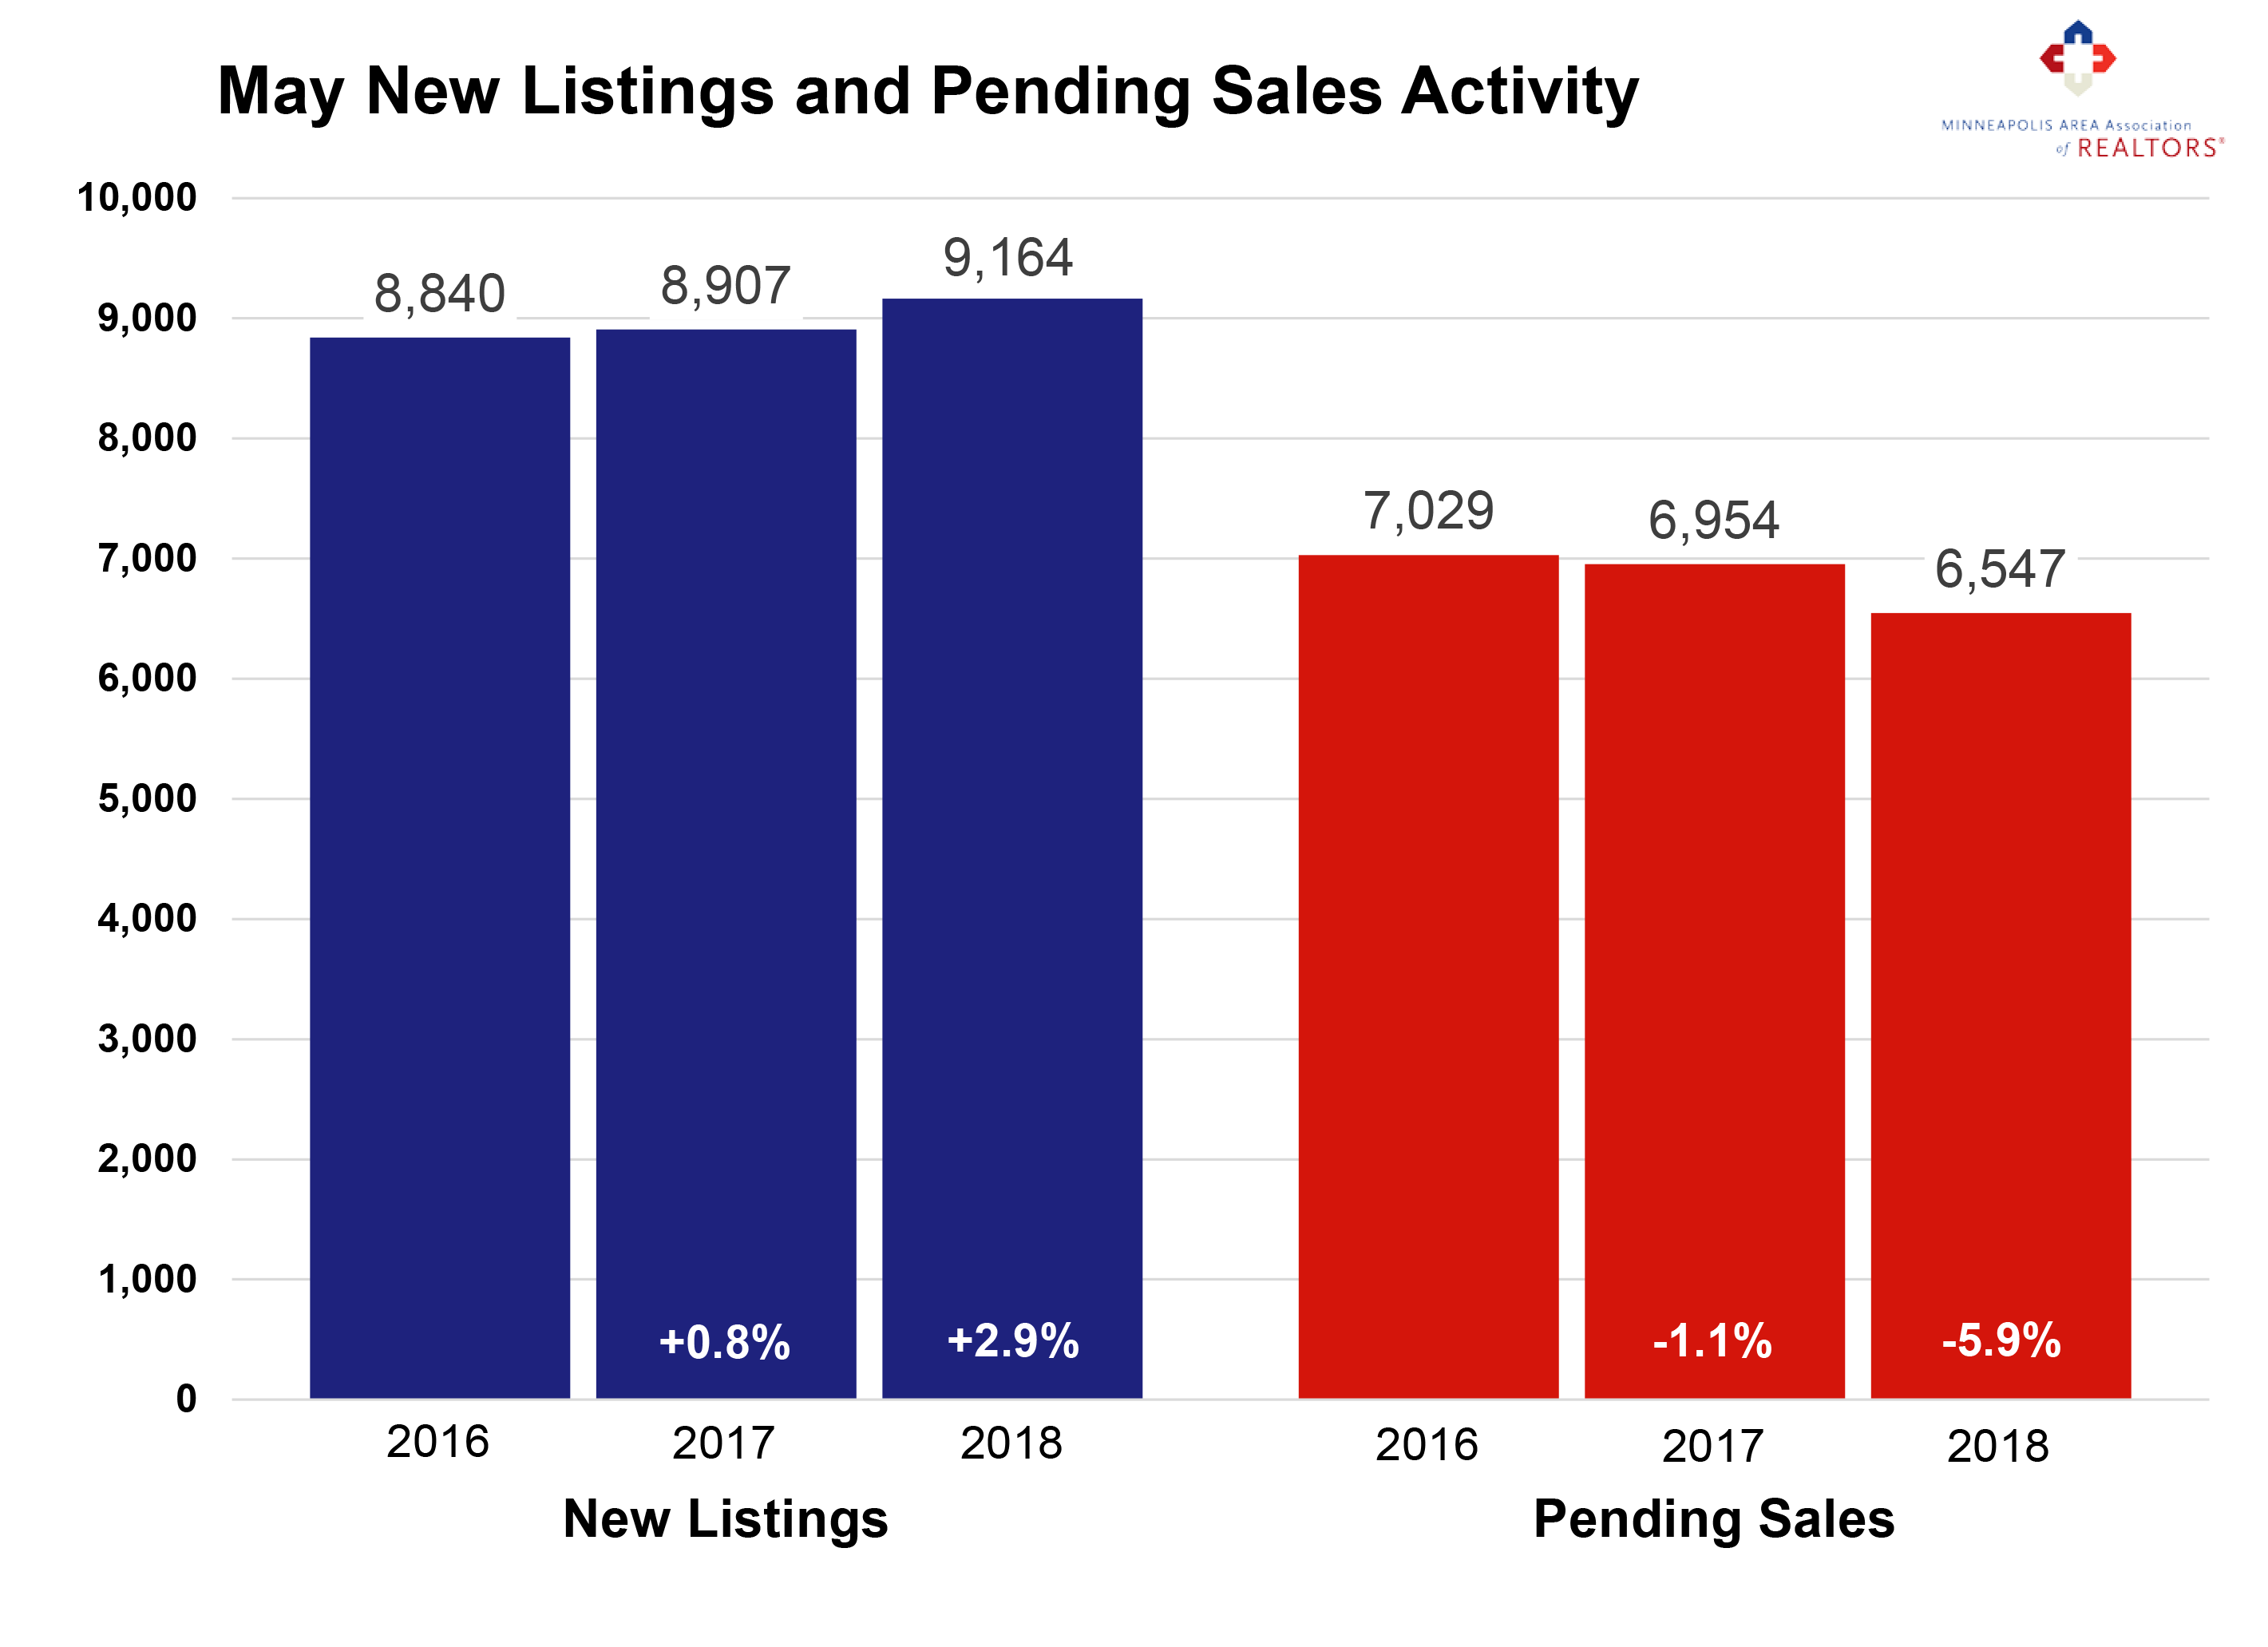
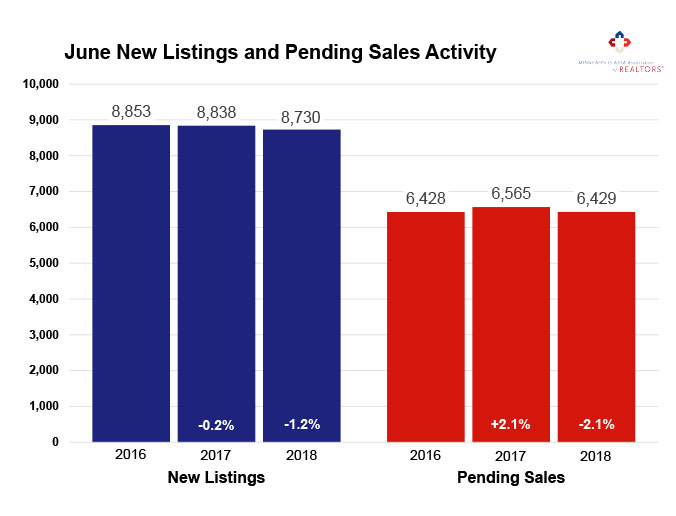
Seller activity was relatively flat in June while buyers pulled back somewhat. For the first time since 2010, new listings surpassed 9,000 in May of this year. That’s encouraging, even though June seller activity was down slightly compared to last year. Increasing or steady seller activity combined with a cool down in demand is consistent with a loosening marketplace. That said, buyers shopping this spring and summer will still face stiff competition. While sellers are receiving full-price-or-better offers in record time, listings still need to show well and be priced properly. June marked the seventh consecutive month of year-over-year declines in closed sales, likely reflecting the shortage of homes for sale.

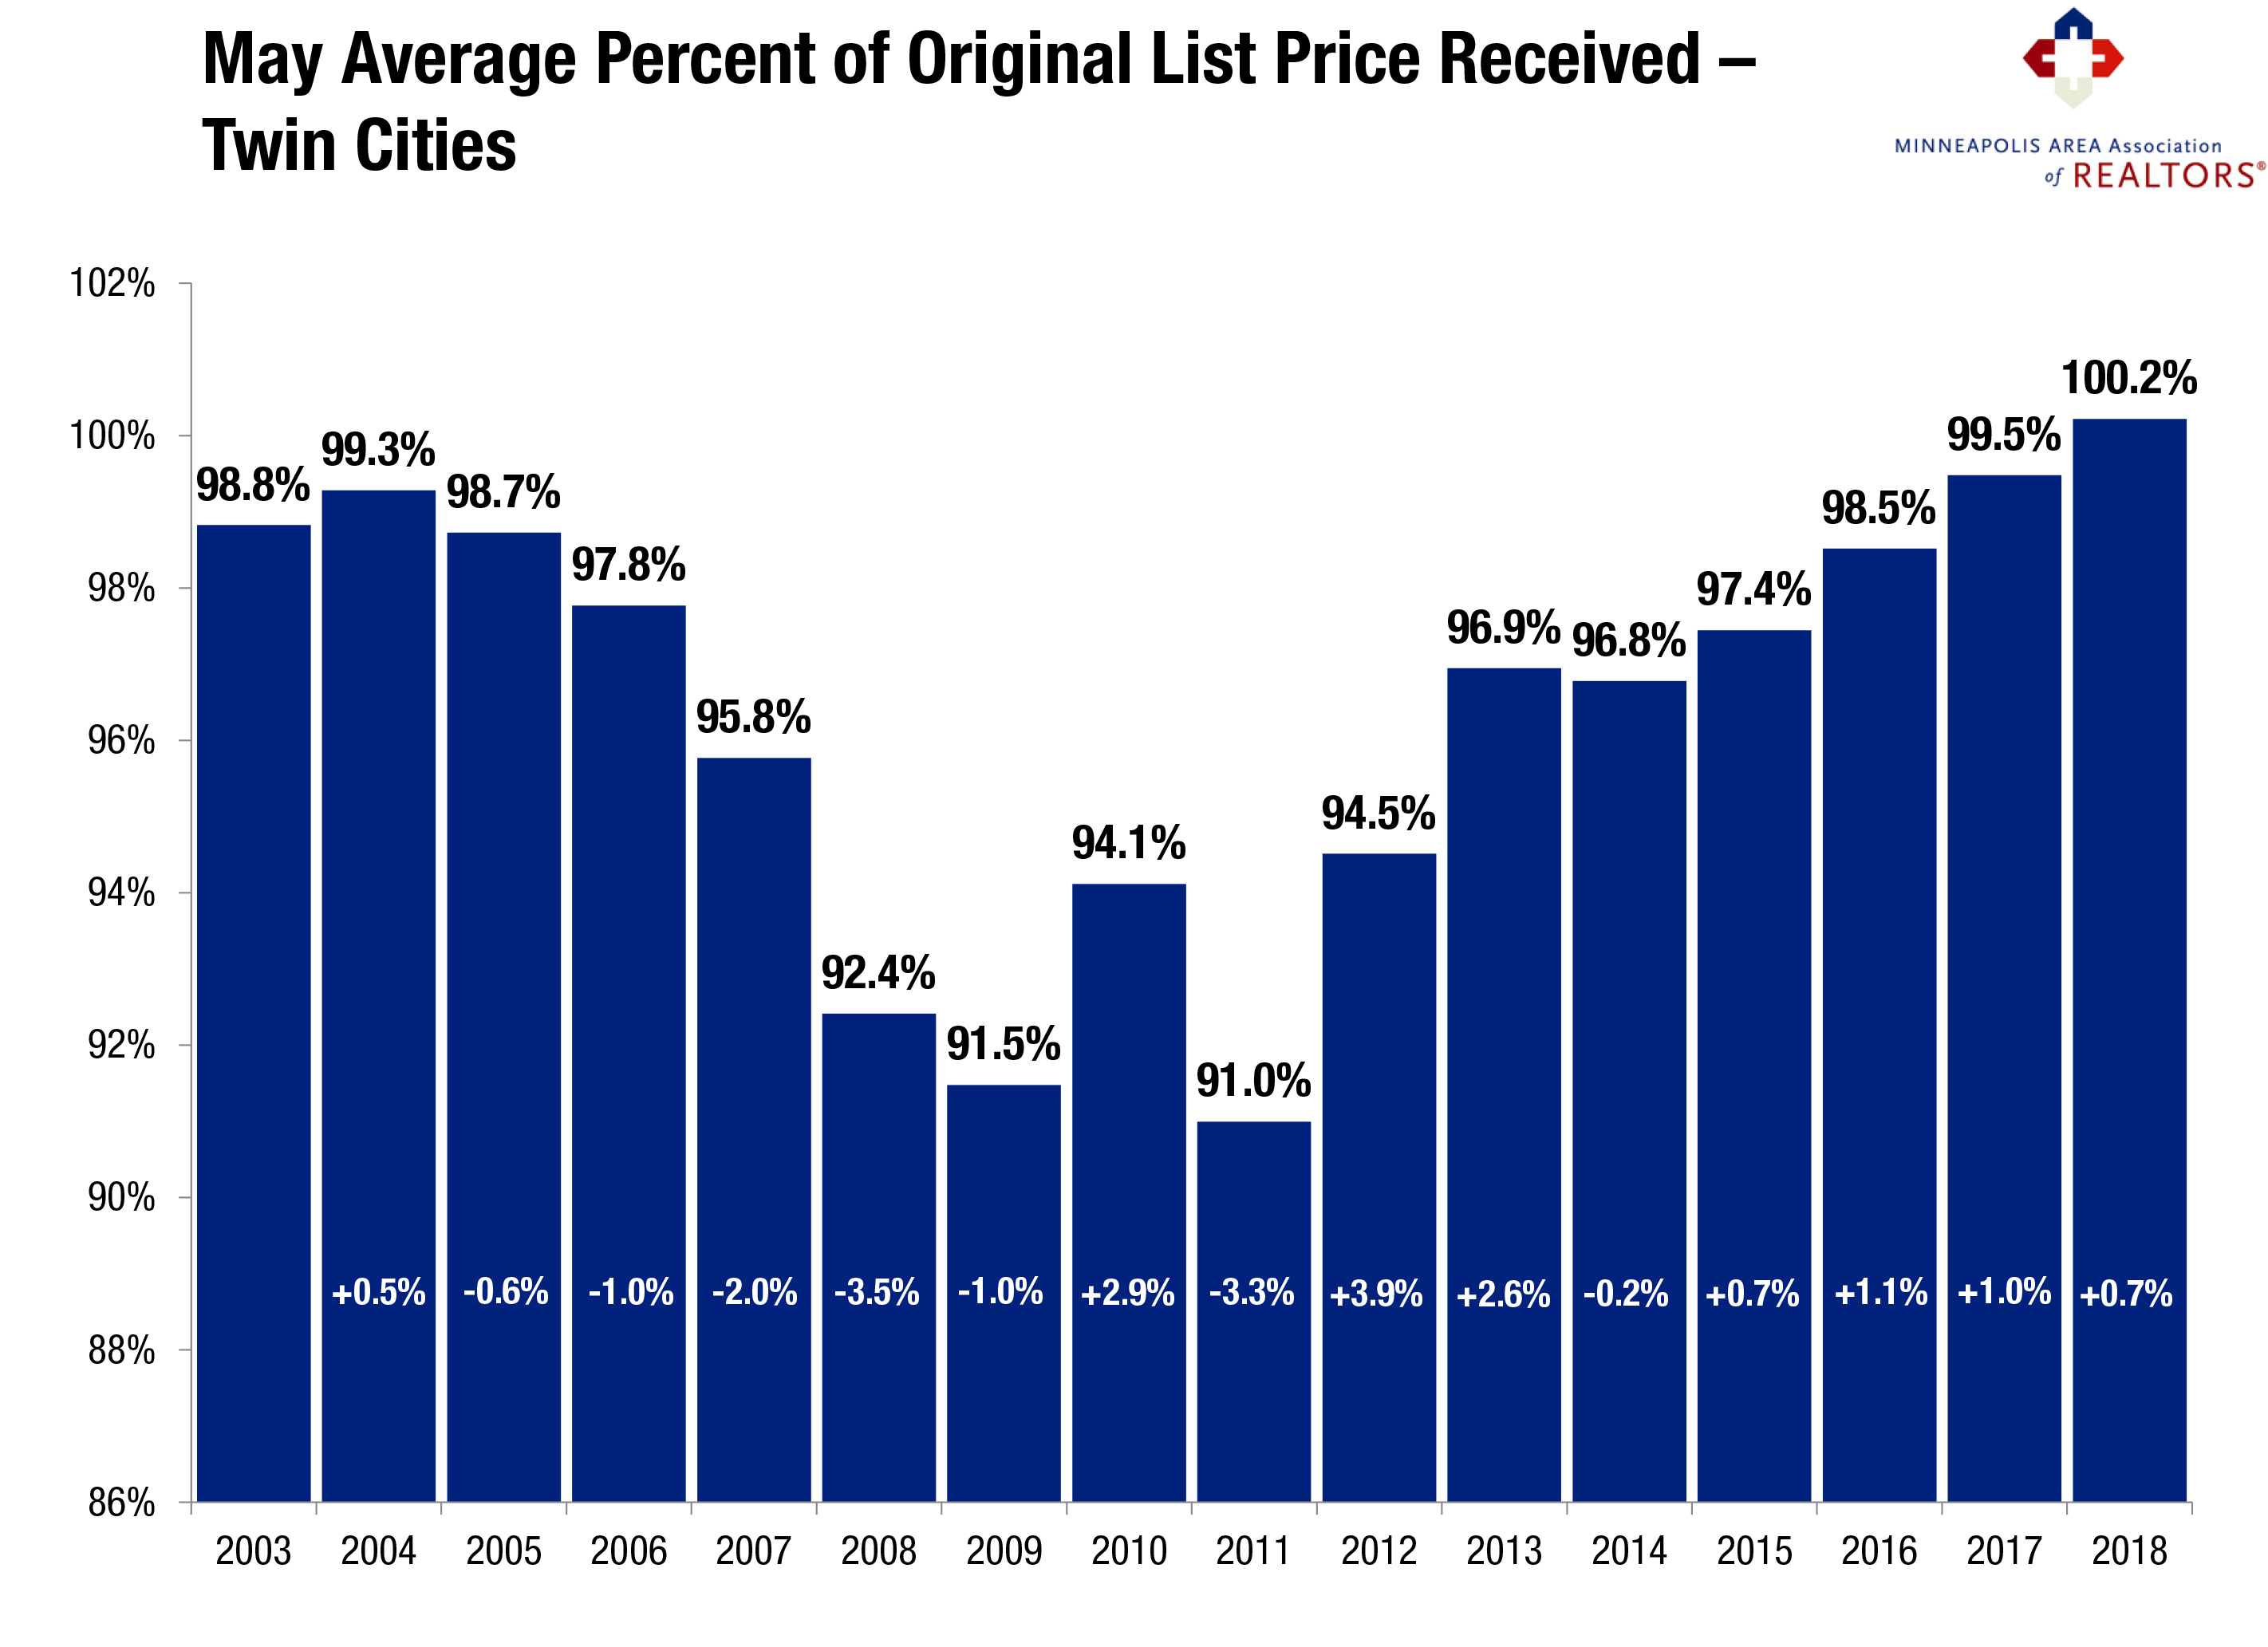
Strong demand and low supply means sellers yielded an average of 100.3 percent of their list price in June, a record high for any month since at least the beginning of 2003. The shortage is especially noticeable at the entry-level prices, where multiple offers and homes selling for over list price have become increasingly common.

The move-up and upper-bracket segments are less competitive and better supplied. Yes, the housing market is tight out there—sometimes frustratingly so. But over 54,000 Twin Cities buyers and sellers have managed to successfully transact real property so far this year.

June 2018 by the Numbers (compared to a year ago)

Sellers listed 8,730 properties on the market, a 1.2 percent decrease
Buyers closed on 7,063 homes, a 8.1 percent decrease
Inventory levels for June fell 15.9 percent compared to 2017 to 11,374 units
Months Supply of Inventory was down 14.8 percent to 2.3 months
The Median Sales Price rose 5.7 percent to $271,900, a record high
Cumulative Days on Market declined 14.6 percent to 41 days, on average (median of 16)
Changes in Sales activity varied by market segment

Single family sales sank 7.1 percent; condo sales rose 8.4 percent; townhome sales declined 13.7 percent
Traditional sales fell 6.6 percent; foreclosure sales sank 39.3 percent; short sales dropped 39.0 percent
Previously-owned sales fell 7.4 percent; new construction sales decreased 4.3 percent

From The Skinny Blog.

Filed Under: The Skinny

Weekly Market Report

July 16, 2018 by Adam Tita

For Week Ending July 7, 2018

As prices persistently rise and months of supply decrease in year-over-year comparisons, it continues to be an ideal time for more sellers to enter the market. Across the U.S., inventory levels are still lagging behind last year, but new listings have perked up nicely so far this year. This has been coupled with many announced new home-building projects across the nation and a more positive tone from the building community.

In the Twin Cities region, for the week ending July 7:

  • New Listings decreased 14.6% to 1,192
  • Pending Sales decreased 10.6% to 1,018
  • Inventory decreased 14.6% to 11,344

For the month of June:

  • Median Sales Price increased 5.3% to $271,000
  • Days on Market decreased 16.7% to 40
  • Percent of Original List Price Received increased 0.8% to 100.3%
  • Months Supply of Inventory decreased 14.8% to 2.3

All comparisons are to 2017

Click here for the full Weekly Market Activity Report. From The Skinny Blog.

Filed Under: Weekly Report

Weekly Market Report

July 9, 2018 by Adam Tita

For Week Ending June 30, 2018

The unemployment rate rose to 4.0 percent in June 2018, marking the first increase in nearly a year. Economic forecasters are calling this a healthy increase indicative of more people being counted as entering the work force in an exceptional job market that added more than 213,000 paying jobs in June. Strong demand for workers combined with low supply creates upward pressure on wages. Employed people with higher wages are generally good for residential real estate.

In the Twin Cities region, for the week ending June 30:

  • New Listings increased 15.1% to 1,864
  • Pending Sales increased 1.1% to 1,519
  • Inventory decreased 16.5% to 11,374

For the month of May:

  • Median Sales Price increased 8.3% to $270,750
  • Days on Market decreased 9.6% to 47
  • Percent of Original List Price Received increased 0.7% to 100.2%
  • Months Supply of Inventory decreased 12.0% to 2.2

All comparisons are to 2017

Click here for the full Weekly Market Activity Report. From The Skinny Blog.

Filed Under: Weekly Report

Weekly Market Report

July 2, 2018 by Adam Tita

For Week Ending June 23, 2018

The first half of the year in residential real estate fared as expected, with the most obvious markers continuing to be low inventory and higher prices. We are also seeing decreased affordability in many markets coupled with more urgency (lower days on market) and increased purchase offers (higher pending sales) ahead of perceived future rate increases that have not yet materialized in the wake of the 0.25 percent increase in the federal funds rate. All of this makes for a busy summer. Let’s examine the local market.

In the Twin Cities region, for the week ending June 23:

  • New Listings increased 1.3% to 1,987
  • Pending Sales decreased 3.7% to 1,437
  • Inventory decreased 16.8% to 11,171

For the month of May:

  • Median Sales Price increased 8.4% to $271,000
  • Days on Market decreased 9.6% to 47
  • Percent of Original List Price Received increased 0.7% to 100.2%
  • Months Supply of Inventory decreased 12.0% to 2.2

All comparisons are to 2017

Click here for the full Weekly Market Activity Report. From The Skinny Blog.

Filed Under: Weekly Report

Weekly Market Report

June 25, 2018 by Adam Tita

For Week Ending June 16, 2018

Sales across the nation have risen not only because this time of year typically offers an increase in residential real estate activity, but because this year in particular has proven to have strong economic and market conditions. While it’s still true that prices are rising and inventory is tightening, these long-standing trends have been happening gradually enough to not deter those who are serious about becoming homeowners.

In the Twin Cities region, for the week ending June 16:

  • New Listings increased 10.1% to 2,057
  • Pending Sales decreased 4.3% to 1,420
  • Inventory decreased 18.0% to 10,898

For the month of May:

  • Median Sales Price increased 8.4% to $271,000
  • Days on Market decreased 9.6% to 47
  • Percent of Original List Price Received increased 0.7% to 100.2%
  • Months Supply of Inventory decreased 12.0% to 2.2

All comparisons are to 2017

Click here for the full Weekly Market Activity Report. From The Skinny Blog.

Filed Under: Weekly Report

May Monthly Skinny Video

June 25, 2018 by Adam Tita

“Buyers need to remain watchful of new listings and make their offers quickly.”

Filed Under: Monthly Skinny Video

Good news for sellers may finally be luring them into the market

June 18, 2018 by Adam Tita

By David Arbit on Monday, June 18th, 2018

More sellers may finally be jumping into the market at a time when buyers are facing the challenges of low inventory. Since 2013, new listing activity has been subdued relative to buyer activity and hasn’t surpassed 9,000 new listings per month since 2010. Excluding 2010, we haven’t had this many new listings for any month since May 2008. Increasing seller activity and tapering demand are consistent with a marketplace that’s starting to loosen up just a bit. That said, buyers shopping this spring and summer will still face stiff competition. Being successful in this market takes commitment, decisiveness and persistence—traits not necessarily typical of every buyer. In fact, May marked the sixth consecutive month of year-over-year declines in closed sales, likely reflecting the lack of homes for sale and not weakness in the economy. Strong demand combined with low supply means sellers yielded an average of 100.2 percent of their list price in May, a record high for any month and the first time this indicator has exceeded 100.0 percent. The shortage is especially noticeable at the entry-level prices, where multiple offers and homes selling for over list price have become increasingly common. Homes continue to sell quickly and for close to or above list price in this tight market, but nearly 12,000 buyers and sellers managed to transact real property last month.

May 2018 by the Numbers (compared to a year ago)

Sellers listed 9,164 properties on the market, a 2.9 percent increase
Buyers closed on 5,739 homes, a 11.3 percent decrease
Inventory levels for May fell 17.8 percent compared to 2017 to 10,403 units
Months Supply of Inventory was down 16.0 percent to 2.1 months
The Median Sales Price rose 8.4 percent to $271,000, a record high
Cumulative Days on Market declined 9.6 percent to 47 days, on average (median of 17)
Changes in Sales activity varied by market segment

Single family sales sank 12.3 percent; condo sales fell 3.5 percent; townhome sales declined 7.5 percent
Traditional sales fell 9.7 percent; foreclosure sales sank 38.1 percent; short sales plummeted 59.7 percent
Previously-owned sales fell 12.4 percent; new construction sales rose 11.1 percent

From The Skinny Blog.

Filed Under: The Skinny

Weekly Market Report

June 18, 2018 by Adam Tita

For Week Ending June 9, 2018

The Federal Reserve recently increased the federal funds rate by 0.25 percent, marking the second rate hike this year and seventh since late 2015. Two more 0.25 percent increases are expected by the end of the year. The 30-year mortgage rate did not increase, yet Fed action can have an indirect effect on the housing market. Buyers often react by trying to lock in at the current rate ahead of assumed future higher rates. Educating consumers that the Fed rate and mortgage rates are not the same can help curb panic buying.

In the Twin Cities region, for the week ending June 9:

  • New Listings decreased 2.7% to 2,094
  • Pending Sales decreased 4.1% to 1,450
  • Inventory decreased 18.5% to 10,623

For the month of May:

  • Median Sales Price increased 8.4% to $271,000
  • Days on Market decreased 9.6% to 47
  • Percent of Original List Price Received increased 0.7% to 100.2%
  • Months Supply of Inventory decreased 12.0% to 2.2

All comparisons are to 2017

Click here for the full Weekly Market Activity Report. From The Skinny Blog.

Filed Under: Weekly Report

Long-Term Price Trend

June 14, 2018 by Adam Tita

By David Arbit on Tuesday, June 12th, 2018

Have you ever wondered to yourself what the home price trendline would look like compared to a hypothetical trendline that starts at the same price in 1990 but increased at a steady and predictable 4% annual growth? Well you’re in luck, because that’s exactly the sort of in-depth market insights that we serve up on a regular basis.

As you can see, recorded average sales prices were well above their trend from 1997 through 2008. The gravity or weight behind the long-term average has an inescapable pull. Some call this return to the average a “reversion to the mean.” There will always be short-term market fluctuations, but the overall long-term direction and growth of the market is upward at around 4-5% per year (before inflation). When we use the 4% figure, prices are only slightly above trend. If we were to use the 5% figure, prices would appear drastically undervalued relative to their long-term average.

The truth, as always, is somewhere in the middle.

*(Note that 2018 data is year-to-date up through April)
From The Skinny Blog.

Filed Under: The Skinny

Weekly Market Report

June 11, 2018 by Adam Tita

For Week Ending June 2, 2018

At this time last year, there were two universal truths in residential real estate across the country. Whether or not sales were up in year-over-year comparisons, the market was assuredly active, and, thus, overall inventory was trending downward compared to the year before. That remained the case for the entirety of 2017, and that refrain sounds entirely familiar for the duration of 2018.

In the Twin Cities region, for the week ending June 2:

  • New Listings decreased 3.0% to 1,946
  • Pending Sales decreased 1.5% to 1,407
  • Inventory decreased 17.6% to 10,530

For the month of April:

  • Median Sales Price increased 8.9% to $266,750
  • Days on Market decreased 10.2% to 53
  • Percent of Original List Price Received increased 0.8% to 99.9%
  • Months Supply of Inventory decreased 20.8% to 1.9

All comparisons are to 2017

Click here for the full Weekly Market Activity Report. From The Skinny Blog.

Filed Under: Weekly Report

  • « Previous Page
  • 1
  • 2
  • 3
  • 4
  • 5
  • 6
  • …
  • 40
  • Next Page »
  • Model
    Location
  • Warranty
  • Better
    Business
    Bureau
  • Builders
    Assoc
  • The Most
    Important
    Tab

Realtor & Housing
Licensed In Minnesota

All information deemed reliable but not guaranteed and should be independently verified.
Copyright © 2025 | Limelight Marketing Systems